
Food: Material-Specific Data
In the Wasted Food Reports, EPA provides estimates of wasted food generation from the food and beverage manufacturing and processing, food retail, food service, and residential sectors, as well as estimates of how it is managed through several pathways, including:
- Animal feed.
- Bio-based materials/biochemical processing.
- Codigestion/anaerobic digestion.
- Composting/aerobic processes.
- Controlled combustion.
- Donation.
- Land application.
- Landfill.
- Sewer/wastewater treatment.
This webpage provides a brief summary of wasted food data.
On this page:
Overview

EPA estimates the generation and management of wasted food in the following sectors:
- Food and beverage manufacturing and processing.
- Residential, which is comprised of single and multi-family households.
- Food Retail, which includes supermarkets, supercenters, and food wholesalers.
- Food service, which includes restaurants, hotels, and sports venues as well as other institutions that provide food service including hospitals, nursing homes, military installations, office buildings, correctional facilities, colleges and universities, and K-12 schools.
- Food banks.
EPA estimates that in 2019, 66 million tons of wasted food was generated in the food retail, food service, and residential sectors, and most of this waste (about 60%) was sent to landfills. An additional 40 million tons of wasted food was generated in the food and beverage manufacturing and processing sectors. The biggest portion of this (42.6%) was managed by anaerobic digestion.
To estimate how each sector manages wasted food, EPA relied on various sector-specific studies, as well as facility-reported anaerobic digestion data and state-reported composting data.
The following diagram depicts the flow of wasted food generated in the food retail, food service, and residential sectors to the management pathways.
WASTED FOOD GENERATION AND MANAGEMENT FLOWS (2019)
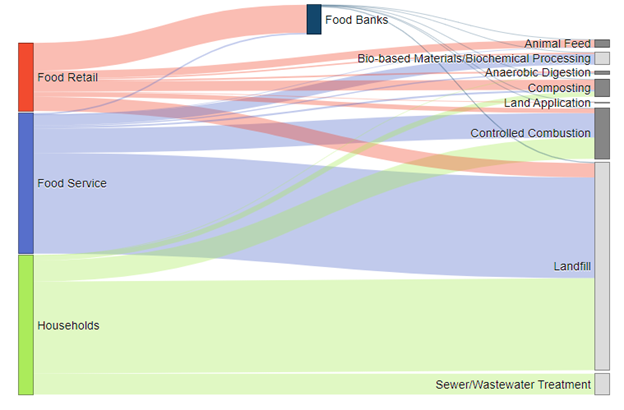
The following table summarizes estimates of how much wasted food was managed in the food retail, food service, and residential sector by each pathway.
WASTED FOOD MANAGEMENT ESTIMATES (2019)
| MANAGEMENT PATHWAY | QUANTITY MANAGED (TONS) | PERCENTAGE MANAGED |
|---|---|---|
| Donation1 | 5,135,293 | 7.76% |
| Animal Feed | 1,516,771 | 2.29% |
| Bio-based Materials/Biochemical Processing | 2,335,988 | 3.53% |
| Anaerobic Digestion | 538,539 | 0.81% |
| Composting | 3,304,764 | 4.99% |
| Land Application | 141,371 | 0.21% |
| Controlled Combustion | 9,646,263 | 14.57% |
| Landfill | 39,621,902 | 59.84% |
| Sewer/Wastewater Treatment | 3,975,352 | 6.00% |
| TOTAL | 66,216,242 | 100.00% |
1 These estimates exclude the small share of excess food (473,027 tons) that food banks cannot distribute and is routed to other management pathways.
Please refer to the 2019 Wasted Food Report and the Wasted Food Measurement Methodology Scoping Memo (2020) (pdf)(1.5 MB) for further information on estimating the generation and management of food waste.
Summary Table and Graph
The data below are from 1960 to 2019, relating to the total number of tons of food generated, recycled, composted, combusted with energy recovery, and landfilled.
| Management Pathway | 1960 | 1970 | 1980 | 1990 | 2000 | 2005 | 2010 | 2015 | 2017 | 2018 | 2019 |
|---|---|---|---|---|---|---|---|---|---|---|---|
| Generation | 12,200 | 12,800 | 13,000 | 23,860 | 30,700 | 32,930 | 35,740 | 39,730 | 40,670 | 63,130 | 66,220 |
| Recycling | 0 | 0 | 0 | 0 | 0 | 0 | 0 | 0 | 0 | 0 | 0 |
| Composted | - | - | - | - | 680 | 690 | 970 | 2,100 | 2,570 | 2,590 | 3,300 |
| Other Food Management | - | - | - | - | - | - | - | - | - | 17,710 | 13,640 |
| Combustion with Energy Recovery | - | 50 | 260 | 4,060 | 5,820 | 5,870 | 6,150 | 7,380 | 7,470 | 7,550 | 9,650 |
| Landfilled | 12,200 | 12,750 | 12,740 | 19,800 | 24,200 | 26,370 | 28,620 | 30,250 | 30,630 | 35,280 | 39,620 |
*Note that 2018 was the first year for which EPA used a new methodology, so the generation estimates increased due to the expanded scope of the new methodology.
A dash in the table means that data is not available.
Wasted Food Reports
These reports describe the measurement methodology used to calculate the 2018 and 2019 wasted food estimates and provide detailed estimates of generation and management by sector. The reports include estimates for the food and beverage manufacturing and processing, food retail, food service, and residential sectors.
- 2018 Wasted Food Report (pdf) Please note that on November 2, 2023, EPA updated this report to correct a typo in Table 2 for the generation factor for food wholesale from 0.01 to 0.005.
- 2019 Wasted Food Report (pdf) Please note that on November 2, 2023, and April 23, 2024, EPA updated this report to correct a typo in Table 1 for the generation factor for manufacturing/processing from 0.005 to 0.095, and for food wholesale from 0.095 to 0.005.
Wasted Food Measurement Methodology Scoping Memo
In 2017, EPA set out to revise its food measurement methodology to more fully capture flows of excess food and food waste throughout the food system, and to provide more granular annual estimates of generation and management of excess food and food waste to the public. This Scoping Memo describes the measurement methodology EPA has used to date, as well as the enhanced methodology that EPA developed between 2017 and 2019. The enhanced methodology examined the following management pathways, which significantly expand the scope beyond EPA’s previous set of management pathways for food waste (i.e., composting, landfill, and combustion):
- Animal feed.
- Bio-based materials/biochemical processing.
- Codigestion/anaerobic digestion.
- Composting/aerobic processes.
- Controlled combustion.
- Donation.
- Land application.
- Landfill.
- Sewer/wastewater treatment.
This enhanced methodology was used to calculate sector-specific estimates of excess food and food waste generation, as well as estimates of how much excess food and food waste was sent to each management pathway, for the year 2016. This Scoping Memo provides detail on the methodologies and studies used, the resulting 2016 estimates, and describes how EPA plans to use the enhanced methodology in its estimates for the “Advancing Sustainable Materials Management: Facts and Figures” report.